
Lights on the Atlantic is a labor of love. This map is a result of 60+ hours of data collection, 20+ hours learning some basic 3D rendering techniques in Blender, and 20+ hours of tweaking and iterating upon the final design and layout. It can be viewed and downloaded in full size here.
To break the production process down:
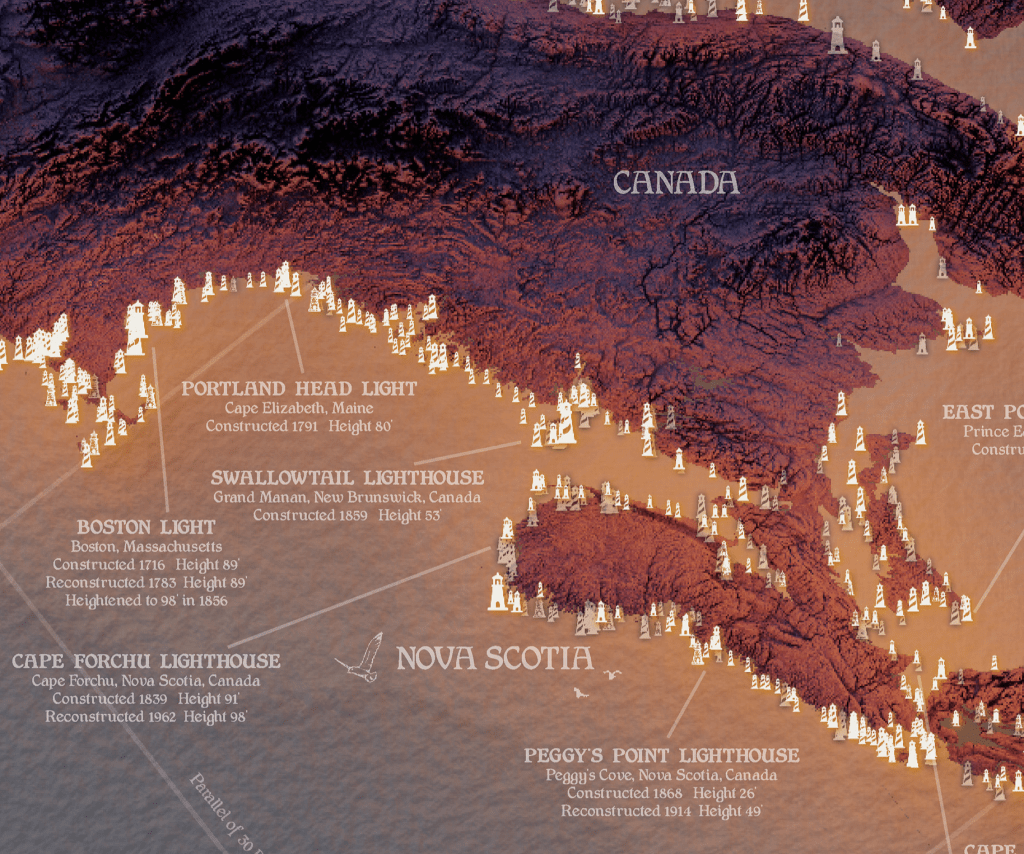
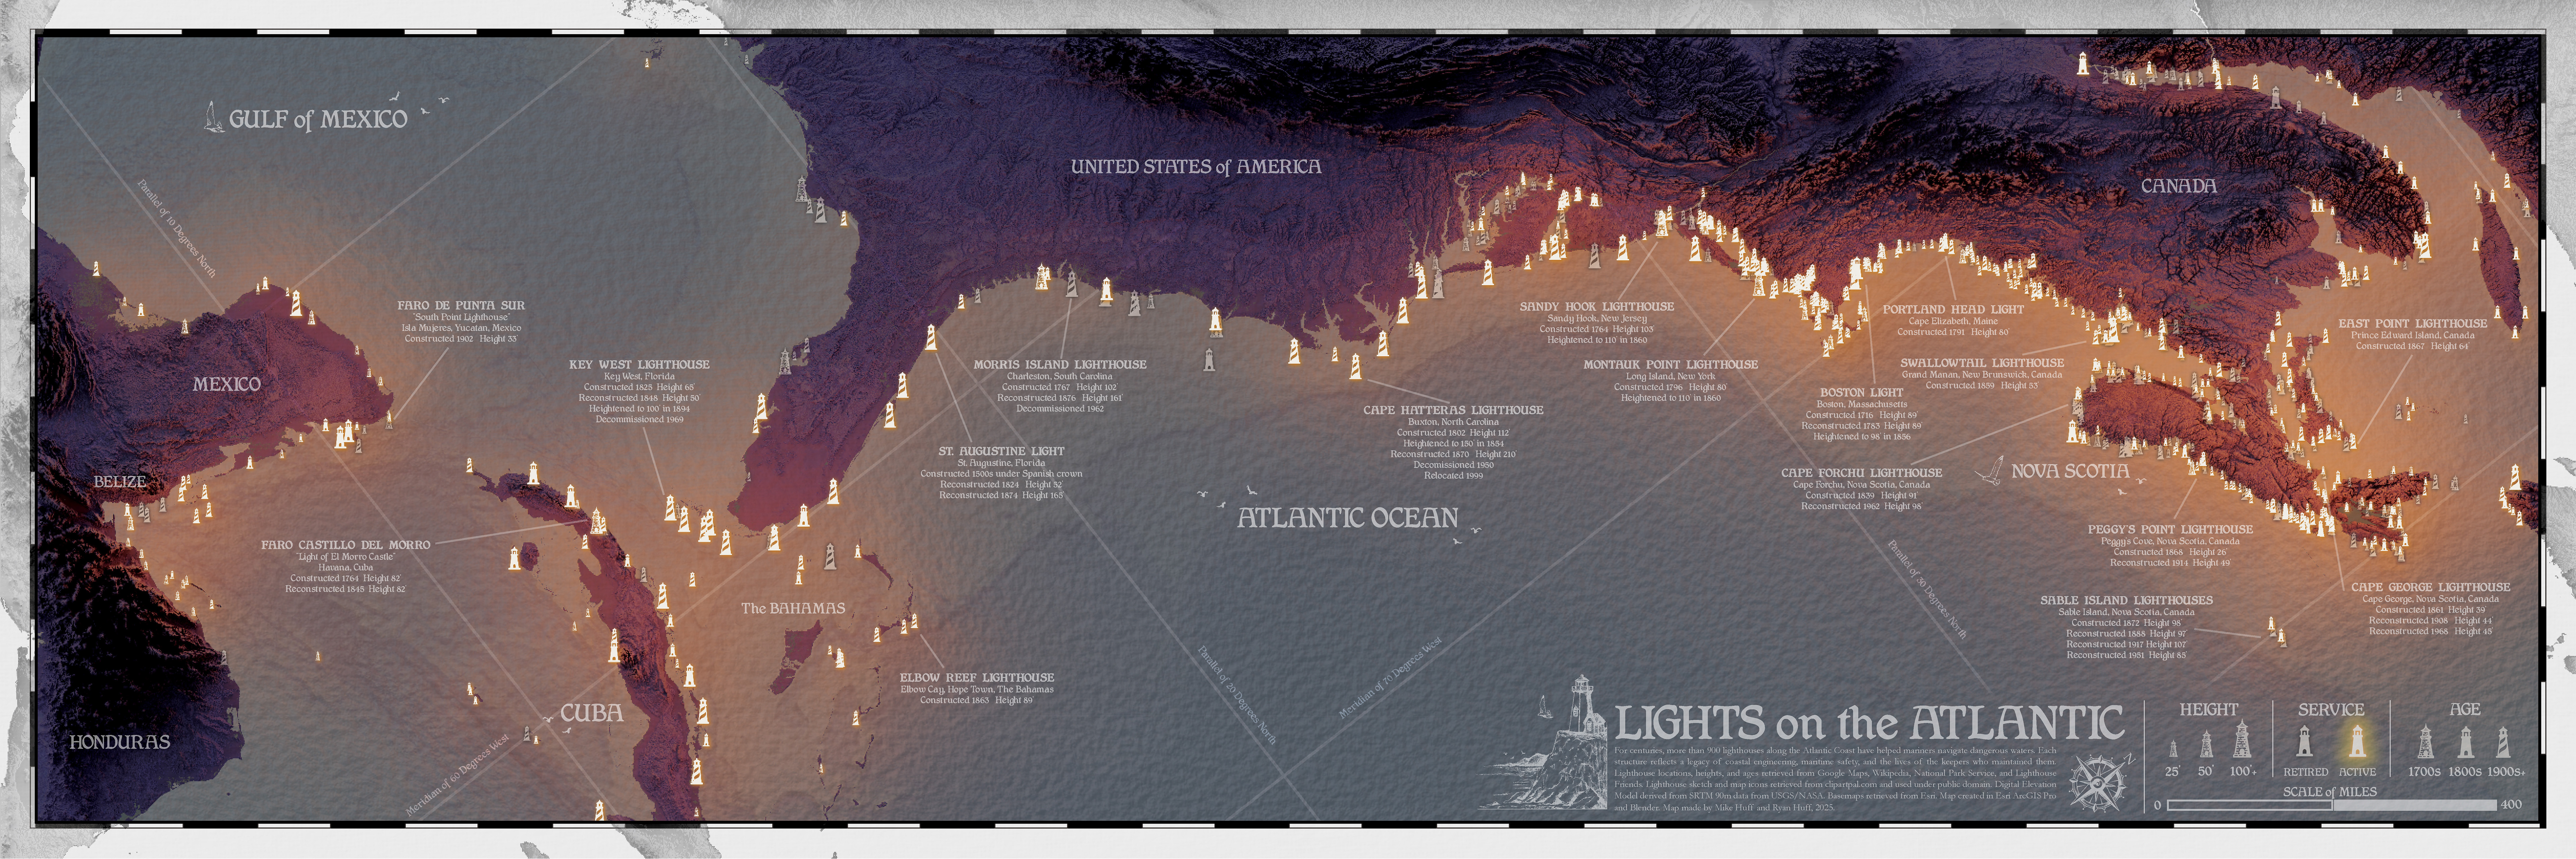
Data: The lighthouse dataset used in this map did not exist prior to this map’s creation. I manually assembled the dataset by scouring the coastlines of this entire area and comparing several datasets (Google Maps, OpenStreetMap, aerial imagery, local tourism guides, etc) to determine whether there was a lighthouse at a given location. Then, I researched each lighthouse to the best of my ability (in several instances having to infer the name of a lighthouse based on its location, e.g., the lighthouse at the eastern point of Prince Edward Island being called East Point Lighthouse, although there are more than a dozen lighthouses on the Atlantic coast simply called “East Point Lighthouse”). This research included finding all public information about the height, age, and service information of each lighthouse. This includes whether the lighthouse was ever destroyed or rebuilt, structurally modified (often this means it was made taller at some point), automated (made to flash without the need for a lighthouse keeper present), or at some point converted to a historical monument or museum. This effort resulted in 906 lighthouses being catalogued, of which I’d estimate around 650 are shown on the final map. Those not shown are the previous iterations (destroyed, rebuilt, heightened) of a more current lighthouse that would be in the exact same place as another icon on the map.
3D Modeling: The terrain and lighthouse datasets left GIS very quickly, and ended up in Blender. I used a 90m SRTM Digital Elevation Model (DEM) dataset for the terrain, which was extruded based on pixel color (black = low, white = high) and exaggerated to produce more dramatic shadows. I converted the lighthouse dataset into an array of light sources in Blender, each lighthouse becoming a tiny orb that produces a warm, orange glow. I converted the terrain to a purple gradient to provide a complementary color to the light, and ran a 3D simulation that produced the version of the terrain you see above; deep, royal purple terrain with a true (but exaggerated) simulated light shining on the 3D terrain.

I then exported this as a high resolution orthographic image and used it as one layer in the final layout.
While in Blender, I decided to also use a 3D water layer instead of a basic 2D water basemap. To do so, I applied a noise map to an object in Blender, giving it very small, random “waves”. The simulated light from each lighthouse was then projected onto this surface as well, and exported separately, again as an orthographic image.
Layout: The final layout was assembled in Adobe InDesign, wherein I layered several datasets as follows, from back to front:
- 3D Terrain Layer (greyscale)
- ESRI Bathymetry Basemap
- 3D Water Layer (with light simulation; 70% opaque)
- Another 3D Water Layer (Multiply Blend Mode)
- Lat/Long Grid (every 10 degrees)
- 3D Terrain
- Lighthouses Layer
- Text Layer (callouts, legend, additional text)
This map was awarded the Cartography Special Interest Group (CartoSIG) Excellence Award as part of the ESRI User Conference 2025, and “Best Cartography” from the Arizona Geographic Information Council (AGIC) 2025 annual meeting. The full AGIC map gallery for 2025 can be viewed here.
© 2025 Michael Huff | HuffMaps.com | Cartography, design, and spatial storytelling

Leave a comment